
|
|
|
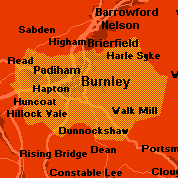
Burnley


|

|
gain
from Labour
|

|
Peter Pike
|

|
0 ( 0.0%)
|

|
9,148 (20.2%)
|

|
26,210 (57.9%)
|

|
7,877 (17.4%)
|

|
0 ( 0.0%)
|

|
2,010 ( 4.4%)
|

|
|

|
67,582
|

|
45,245 (66.9%)
|


|
Peter Pike
|

|
Burnley
|

|
11,491 (22.4%)
|

|
15,693 (30.6%)
|

|
27,184 (53.0%)
|

|
8,414 (16.4%)
|

|
0 ( 0.0%)
|

|
0 ( 0.0%)
|
|
|
Labour
|

|
69,176
|

|
51,291 (74.1%)
|
|


|
-10.4%
|

|
+4.9%
|

|
+1.0%
|

|
+0.0%
|

|
+4.4%
|

|
-2.3%
|

|
-7.2%
|
|
|
|
Burnley is fairly typical of many of the former Lancashire cotton towns. Working class owner-occupiers, including an inner-city Asian population, plus better-off suburban streets and a certain lingering civic pride, create seats which, despite their industrial heritage, Labour has not always been able to rely on. Burnley was only just held by Labour in 1983, but this is now one of Labour's safer Lancashire seats, and should be held safely in 1997.
|
|

|

|

|

|

|

|

|
1,111
|
2.73
|
9.03
|
30
|
|

|
286
|
0.70
|
11.17
|
6
|
|

|
5,253
|
12.90
|
11.25
|
115
|
|

|
7,013
|
17.23
|
14.70
|
117
|
|

|
2,990
|
7.34
|
10.45
|
70
|
|

|
0
|
0.00
|
2.81
|
0
|
|

|
2,676
|
6.57
|
8.01
|
82
|
|

|
6,417
|
15.76
|
15.25
|
103
|
|

|
10,810
|
26.55
|
7.13
|
372
|
|

|
4,105
|
10.08
|
10.17
|
99
|
|
|
