
|
|
|
Chelmsford West


|

|
gain
from Conservative
|

|
Simon Burns
|

|
0 ( 0.0%)
|

|
23,781 (40.6%)
|

|
15,436 (26.4%)
|

|
17,090 (29.2%)
|

|
0 ( 0.0%)
|

|
2,270 ( 3.9%)
|

|
|

|
76,086
|

|
58,577 (77.0%)
|


|
Simon Burns
|

|
Chelmsford
|

|
16,186 (25.9%)
|

|
34,284 (54.8%)
|

|
9,443 (15.1%)
|

|
18,098 (28.9%)
|

|
0 ( 0.0%)
|

|
699 ( 1.1%)
|
|
|
Conservative
|

|
73,616
|

|
62,524 (84.9%)
|
|


|
-14.2%
|

|
+11.2%
|

|
+0.2%
|

|
+0.0%
|

|
+2.8%
|

|
+3.4%
|

|
-7.9%
|
|

|
|
|
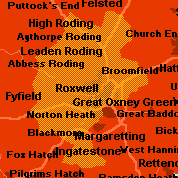
In the recent boundary changes, Essex's county town Chelmsford has been split in two, and the eastern half (mostly villages and suburbs) linked with Maldon. This is the successor constituency to the old Chelmsford - predominantly middle-class and well-off, it is undeniable Tory country. Yet the Liberals mounted a strong challenge in the 1970s and 1980s against Norman St John Stevas, one of the prominent Tory 'wets' purged from Mrs Thatcher's cabinet. Although the Liberals reduced St John-Stevas' majority to 378 in 1983, they never inherited the seat, and Simon Burns, a Thatcherite who replaced St John Stevas after the latter retired to the Lords, can expect a five-figure majority. Thatcherism lives on in this corner of Essex.
|
|

|

|

|

|

|

|

|
5,232
|
12.60
|
9.03
|
139
|
|

|
6,304
|
15.18
|
11.17
|
136
|
|

|
7,107
|
17.11
|
11.25
|
152
|
|

|
7,703
|
18.54
|
14.70
|
126
|
|

|
4,851
|
11.68
|
10.45
|
112
|
|

|
394
|
0.95
|
2.81
|
34
|
|

|
2,393
|
5.76
|
8.01
|
72
|
|

|
5,981
|
14.40
|
15.25
|
94
|
|

|
255
|
0.61
|
7.13
|
9
|
|

|
1,095
|
2.64
|
10.17
|
26
|
|
|
