
|
|
|
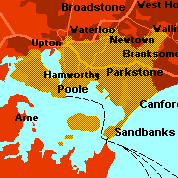
Poole


|

|
gain
from Conservative
|

|
John Ward (Retiring)
|

|
0 ( 0.0%)
|

|
19,726 (42.1%)
|

|
10,100 (21.6%)
|

|
14,428 (30.8%)
|

|
0 ( 0.0%)
|

|
2,556 ( 5.5%)
|

|
|

|
66,078
|

|
46,810 (70.8%)
|


|
John Ward (Retiring)
|

|
Poole
|

|
12,981 (25.8%)
|

|
27,768 (55.1%)
|

|
5,880 (11.7%)
|

|
14,787 (29.3%)
|

|
0 ( 0.0%)
|

|
1,950 ( 3.9%)
|
|
|
Conservative
|

|
64,285
|

|
50,385 (78.4%)
|
|


|
-13.0%
|

|
+9.9%
|

|
+1.5%
|

|
+0.0%
|

|
+1.6%
|

|
+2.8%
|

|
-7.5%
|
|
|
|
Traditionally a resort adjacent to Bournemouth, but a very substantial town in its own right, Poole's dynamic modern light industrial economy powered significant population growth during the 1980s. Although the Liberal Democrats do well in local government elections, this is a safe Conservative parliamentary seat.
|
|

|

|

|

|

|

|

|
1,310
|
3.35
|
9.03
|
37
|
|

|
9,597
|
24.56
|
11.17
|
220
|
|

|
3,848
|
9.85
|
11.25
|
88
|
|

|
5,237
|
13.40
|
14.70
|
91
|
|

|
710
|
1.82
|
10.45
|
17
|
|

|
0
|
0.00
|
2.81
|
0
|
|

|
9,721
|
24.88
|
8.01
|
311
|
|

|
6,579
|
16.84
|
15.25
|
110
|
|

|
715
|
1.83
|
7.13
|
26
|
|

|
715
|
1.83
|
10.17
|
18
|
|
|
