
|
|
|
Tyne Bridge


|

|
gain
from Labour
|

|
David Clelland
|

|
0 ( 0.0%)
|

|
3,861 (11.1%)
|

|
26,767 (76.8%)
|

|
2,785 ( 8.0%)
|

|
0 ( 0.0%)
|

|
1,437 ( 4.1%)
|

|
|

|
61,058
|

|
34,850 (57.1%)
|


|
David Clelland
|

|
Tyne Bridge
|

|
19,077 (44.7%)
|

|
9,443 (22.1%)
|

|
28,520 (66.8%)
|

|
4,755 (11.1%)
|

|
0 ( 0.0%)
|

|
0 ( 0.0%)
|
|
|
Labour
|

|
67,085
|

|
42,718 (63.7%)
|
|


|
-11.0%
|

|
+10.0%
|

|
-3.1%
|

|
+0.0%
|

|
+4.1%
|

|
-9.0%
|

|
-6.6%
|
|

|
|
|
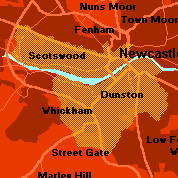
This seat, spanning the inner-city portions of both Newcastle and Gateshead, is possibly the most blighted constituency in the whole of England's struggling North East, with the highest rate of male unemployment in the region - 23 per cent in 1991, the highest percentage of council housing: 45 per cent, and some extremely poor ethnic minority communities like Bangladeshis, who have been subjected to much racial abuse and persecution. Given this, it would be surprising if Labour did not enjoy consistently large majorities - their Dave Clelland faces a no-contest situation.
|
|

|

|

|

|

|

|

|
128
|
0.30
|
9.03
|
3
|
|

|
125
|
0.29
|
11.17
|
3
|
|

|
1,058
|
2.45
|
11.25
|
22
|
|

|
3,669
|
8.49
|
14.70
|
58
|
|

|
4,086
|
9.45
|
10.45
|
90
|
|

|
0
|
0.00
|
2.81
|
0
|
|

|
3,117
|
7.21
|
8.01
|
90
|
|

|
6,725
|
15.56
|
15.25
|
102
|
|

|
5,614
|
12.99
|
7.13
|
182
|
|

|
17,709
|
40.98
|
10.17
|
403
|
|
|
