
|
|
|
Orpington


|

|
gain
from Conservative
|

|
John Horam
|

|
0 ( 0.0%)
|

|
24,417 (40.6%)
|

|
10,753 (17.9%)
|

|
21,465 (35.7%)
|

|
0 ( 0.0%)
|

|
3,527 ( 5.9%)
|

|
|

|
78,749
|

|
60,162 (76.4%)
|


|
John Horam
|

|
Orpington
|

|
17,930 (26.9%)
|

|
36,770 (55.3%)
|

|
9,837 (14.8%)
|

|
18,840 (28.3%)
|

|
0 ( 0.0%)
|

|
1,085 ( 1.6%)
|
|
|
Conservative
|

|
82,032
|

|
66,532 (81.1%)
|
|


|
-14.7%
|

|
+3.1%
|

|
+7.4%
|

|
+0.0%
|

|
+4.2%
|

|
-4.0%
|

|
-4.7%
|
|

|
|
|
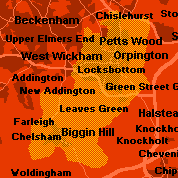
Orpington, sprawling along the Kentish borders of Greater London, is dominated by Conservative leafy suburban avenues and roads, with a few pockets of Labour support in St Mary Cray and St Paul Cray. The famous Liberal by-election victory here in 1962 is now a distant memory. Tory MP John Horam, who has travelled to the Conservative Party from the Labour benches, via the Social Democrats, and who has therefore represented three different parties in parliament, will remain safe. His continuing parliamentary career should afford him enough years to change parties yet again should he so wish.
|
|

|

|

|

|

|

|

|
6,514
|
15.19
|
9.03
|
168
|
|

|
5,892
|
13.74
|
11.17
|
123
|
|

|
12,467
|
29.06
|
11.25
|
258
|
|

|
4,913
|
11.45
|
14.70
|
78
|
|

|
1,226
|
2.86
|
10.45
|
27
|
|

|
339
|
0.79
|
2.81
|
28
|
|

|
2,635
|
6.14
|
8.01
|
77
|
|

|
4,791
|
11.17
|
15.25
|
73
|
|

|
1,979
|
4.61
|
7.13
|
65
|
|

|
1,790
|
4.17
|
10.17
|
41
|
|
|
