
|
|
|
Worcester


|

|
gain
from Conservative
|

|
Peter Luff (Contesting different seat)
|

|
0 ( 0.0%)
|

|
18,423 (35.7%)
|

|
25,848 (50.1%)
|

|
6,462 (12.5%)
|

|
0 ( 0.0%)
|

|
886 ( 1.7%)
|

|
|

|
69,234
|

|
51,619 (74.6%)
|


|
Peter Luff (Contesting different seat)
|

|
Worcester
|

|
2,947 ( 5.6%)
|

|
23,960 (45.5%)
|

|
21,013 (39.9%)
|

|
6,890 (13.1%)
|

|
0 ( 0.0%)
|

|
823 ( 1.6%)
|
|
|
Conservative
|

|
63,624
|

|
52,686 (82.8%)
|
|


|
-9.8%
|

|
+10.2%
|

|
-0.6%
|

|
+0.0%
|

|
+0.2%
|

|
+8.8%
|

|
-8.3%
|
|

|
|
|
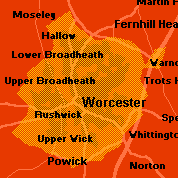
The notion of 'Worcester Woman', recently floated as a key target voter, is of course misguided; to win a general election a party has to do better than appeal to a niche market of any kind. Nevertheless this myth does indicate one thing - that Worcester is a critical marginal, where it is desirable to woo voters if one wishes to form a government.
This is itself something new. Historically Worcester has not been regarded as a marginal; Labour has never won it, not even in 1945 or 1966. But things have changed now. The Boundary Commission has reduced the halo of Tory villages that used to surround the city, places with rolling Worcestershire names like Inkberrow and Upton Snodsbury. The seat is now a compact urban core. The effective majority in 1992 would have been reduced from 6,152 to about half of that. Labour now need a swing of less than 3 per cent to register their first ever win in the constituency of Worcester.
|
|
|

|

|

|

|

|

|

|

|
2,012
|
5.10
|
9.03
|
56
|
|

|
3,495
|
8.86
|
11.17
|
79
|
|

|
5,942
|
15.07
|
11.25
|
134
|
|

|
8,589
|
21.78
|
14.70
|
148
|
|

|
3,765
|
9.55
|
10.45
|
91
|
|

|
0
|
0.00
|
2.81
|
0
|
|

|
5,441
|
13.79
|
8.01
|
172
|
|

|
4,499
|
11.41
|
15.25
|
75
|
|

|
3,165
|
8.02
|
7.13
|
113
|
|

|
1,910
|
4.84
|
10.17
|
48
|
|
|
